A histogram generated as a “gedankenexperiment” for a wheel-mounted front-end loader, described in Part 1 of this article, July’s “Optimize Mobile-Equipment Control Through Statistical Analysis,” was based upon reasonable estimates of a real work process. The operating scenario proposed a relatively long distance between the load pickup pile and the load dumping point.
The hypothetical vehicle was seen as driving into the pile, picking up the load, backing out, turning around, traveling to the dump point, dumping the load, and then returning to start the cycle over again. Because of the long distance between the pile and the dump point, the histogram skews to the high-speed, low-load end of the speed range. That is, the histogram tells us that the vehicle spends more of its operational life in the high-speed range rather than the low-speed range.
The goal of histogram creation, covered in June’s “Pinpoint Power-Loss Problems,” is to develop a systematic predicting process — in other words, to predict the conditions that will result in energy losses while considering the special conditions that exist in the application. Assembling such histograms formulates a probability that a certain speed will occur.
Histogram flexibility
Data-collection devices must be installed on the application vehicle while the operator puts it through its normal paces. Although the earlier article stated that data-acquisition/logging equipment should be installed temporarily, this isn’t a hard and fast rule. It’s possible to have it operational and utilize on-board computers and data-storage facilities while the machine is running. As a result, the histogram can go through constant updates to keep changes up to date. This data then can be used to create adaptive control schemes, which enable all new operational cycles to be tuned to maximize productivity and/or minimize energy loss.
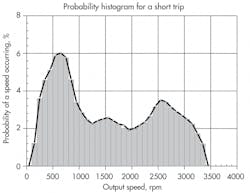
Important to note: The predictability of performance is valid only if the application histogram of the process that’s undergoing prediction is statistically similar to the one for the benchmarked system. “Statistically similar” means that future histograms should have a shape similar to the example hydrostatic transmission histogram of Figure 4. If the process changes and creates a differently shaped histogram, the lost energy will change commensurately.
Same transmission, different process
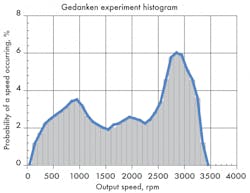
The example described here illustrates what happens when there’s a process change. The same transmission and vehicle described in Part 1 are used, but with a somewhat altered application: The loading pile and the dumping point are close together, so the loader never gets up to full speed. Instead, it spends most of its time in the low-speed range. As a result, the histogram is biased toward the low-speed, high-torque region of transmission operation. That is, the machine spends a majority of its time at the low-speed operating condition, Figure 5.
Actually, the new histogram, is a continuation of the gedankenexperiment process and is the product of this author’s expediency. It’s merely the mirror image of the probability curve, Figure 6 (which is the same as Figure 2 shown last month). It is not a real-world action to simply declare that a histogram would have the same shape, but reversed. The key issue here is that when the histogram changes, there is also a change in total lost energy. The intent is to show how changes in the histogram’s shape affect the total lost energy. The rationale, however, seems reasonable. Because the trip is so short, more time is spent at the loading site, filling the loader bucket, backing out, propelling a short distance to the dump site, and returning to start the cycle over again. Less time is spent at higher speeds.
Lost power calculation for a “different process
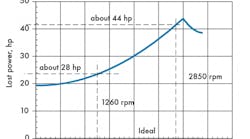
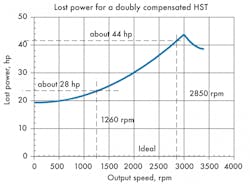
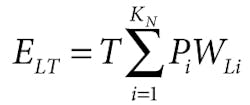
A program was written (LOSTNRGY.EXE) to determine the total energy lost in the loader’s hydrostatic transmission during an eight-hour work cycle. Using the probability histogram in Figure 4 and the Power Lost characteristic in Figure 1, it performed the summation shown in the green box.
where:
T = the total time interval for evaluating the lost energy (units of time are arbitrary)
Pi = the probability of a speed occurring in the ith probability histogram interval (numeric)
WLi = the power lost when operating at the midpoint speed of the ith probability histogram interval (hp)
KN = the total number of speed intervals in the probability histogram (numeric)
ELT = the total energy lost during the time interval of T (units depend on those used for T)The program calculates the total lost energy for a specifiable amount of time. For purposes of comparison, the time was set to eight hours.
Results showed that total lost energy for an 8-hr interval was 223 hp-hrs, an 11% reduction in lost energy when compared to the lost-energy calculation in Part 1. The energy reduction results from the operational histogram being a more harmonious match, efficiency-wise, than the long-trip process. This example problem does not take into account the other consequences of the shorter trip (e.g., more individual trips are made and more product is moved in the eight hours, but just not as far). This turns into more of a “black box” approach, looking only at the overall performance characteristics of the transmission and the statistical properties of the process.
The use of Lost Power characteristics along with the process probability histograms has the potential to optimally match the machine to the application. By performing onboard histogramming, the on-board computer can potentially adapt the transmission to the applicati
