Download this article as a .PDF
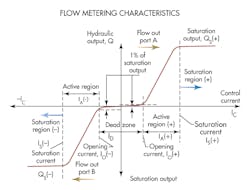
Although it is more detailed than what you’ll typically see in technical literature from valve manufacturers, the accompanying illustration reveals several key valve operating characteristics:
- opening (cracking) current,
- width of the dead zone,
- width of the active region,
- saturation flow,
- flow gain, and
- linearity.
The valve cracking point is that instant when the valve just begins to open. That may seem like a simple and clear statement, but it is not. Because there is always leakage in spool valves, flow variations take place all through the overlap, or dead zone of the valve. (The dead zone is the very low-flow region that exists between the two cracking points.)
Therefore, knowledgeable people must agree on how much output flow constitutes valve opening. ISO 10770-1 presented an opportunity to set an international standard value. However, the formulators of that document chose expediency and avoidance of controversy over enlightenment, and said nothing.
The Milwaukee School of Engineering, the beneficiary of an industrial research project some years ago, took a stand to define the condition of valve opening as “that point where the output flow has risen to a value of 1% of the full-shift flow.” It is a good definition because it is based on the practical features of spool valves. With it, more parameters can be defined.
Rated flow can be determined from the metering curve shown, as long as the supply pressure is set to and maintained at the valve’s flow rating pressure:
QS = QR / PS,T = PS,QR
Where:
PS,T is supply pressure when making the metering curve, and
PS,QR is the supply pressure used for flow rating purposes.
For servovalves (ISO 10770-1), the standard test pressure is 7 MPa (1,015 psi). Proportional valves are rated at 1 MPa. The formulators of ISO 10770-1 could have defined servo and proportional valves, but they chose not to. Instead, they avoided controversy and responsibility by instructing the reader to test at 7 MPa or 1 MPa, “as appropriate.” Thus, the difference between a proportional valve and a servovalve is based not on performance differences, but rather by the pressure at which the flow rating test was conducted.
Developing a Gain Plan
Flow gain is the rate at which output flow changes with respect to change in control input current. With no differential load pressure:
GQ = dQ/dI
For non-linear valves, it may be advisable to determine the average flow gain. Unfortunately, there are several ways to define an average flow gain for a non-linear valve, all of which yield different values.
On the other hand, flow gain is not a very important valve parameter. This is because the valve pressure drop is always changing in the application. Consequently, the flow gain is always changing.
More important is the velocity gain of the actuator relative to the valve’s input control current. Because of the square/square-root relationship between flow and pressure drop, flow gain can be evaluated at test pressures other than the flow rating pressure. Furthermore, flow gain can be calculate for pressures other than the flow rating pressure:
GQ, APP = GQR (PSAPP / PSQR)1/2
Where:
GQ, APP is the flow gain in the application,
GQr is the flow gain derived from rated flow while operated at rated pressure,
PSAPP is the supply pressure at application time, and
PSQR is the test pressure used to flow-rate the valve.
Flow gain often is quoted by users and manufacturers of servovalves, and sometimes proportional valves. However, its importance is overstated. A far more important system parameter is velocity gain, which is application related. It accounts for the flow gain of the valve, the actuator size or displacement, the load on the actuator, and the supply pressure. In contrast, flow gain is a valve-only parameter, and it is valid only at a specific supply pressure. Furthermore, flow gain does not in any way account for the myriad variations in the application, such as actuator size, load, and supply pressure.
Linearity or Non-Linearity?
Technical literature always reports linearity of a valve’s metering characteristics. Actually, it is evaluating the valve’s non-linearity. For instance, one popular servovalve is listed as having “linearity of less than 3%.” If the valve is only 3% linear, it must be 97% nonlinear. It is difficult to even imagine such an abomination! Clearly, that is not the interpretation intended by the valve’s manufacturer in expressing linearity. What is meant is that the valve is 3% non-linear and, therefore, 97% linear.
A much more important valve parameter is the dead zone. A valve with substantial dead zone is rendered useless in applications that seek null as the ultimate operating conditions, such as in positioning systems and some pressure-control systems. Although helpful, electronic dead-zone compensators prevalent in valve controllers cannot truly compensate for valve overlap.
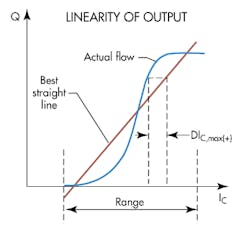
In essence, linearity is the degree to which the metering curve agrees with a best fit straight line. Linearity is only marginally important and can easily be corrupted in literature. To fit and compare the straight line, the range limits over which the fit is to apply has to be defined. The limit for the straight line in the accompanying illustration was chosen as the nominal active metering zone of the valve.
An evaluation based on the maximum deviation between the metering curve and the straight line (with smaller deviation being better linearity) will produce a higher value than if the straight line were rotated counterclockwise about the point where the two curves intersect. On the other hand, if the straight line passes through the origin, a much higher degree of non-linearity results. Reporting standards, such as ISO 10770-1, are totally silent on how non-linearity should be measured and reported.
Hysteresis
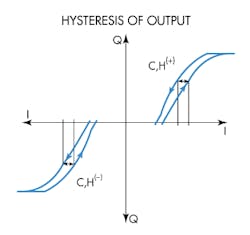
For a proportional valve, hysteresis is the point of widest separation between the metering characteristic curve with increasing input relative to the characteristic with decreasing input, as measured along a horizontal line. This idea is presented in the illustration for a proportional valve with substantial overlap. Note that with an overlapped valve, the maximum horizontal separation is evaluated for both A port output flow and B-port output flow. However, the delta values are divided by the total current difference between negative saturation and positive saturation (flow metering characateristics in the first illustration define the values for IA+ and IA−, as applied to the following formula):
HPV = (∆IC, H+ + ∆IC, H-) / (∆IA+ + ∆IA-)
For a zero lapped servovalve, the approach for evaluating the hysteresis is a bit simpler. There is no distinction made between the positive and negative flow portions of the metering characteristics. The entire metering curve is scanned for both increasing and decreasing input current, the widest horizontal separation is reported, and the hysteresis is evaluated as:
HSV = ∆IC, H / IS (+)
Where IC,H is the widest separation between increasing and decreasing input characteristic found anywhere on the metering curve.
Over the Threshold
Threshold is an attempt to separate and measure the portion of valve hysteresis caused by friction from the portion caused by the magnetization properties of the torque motor’s internal ferromagnetic parts. In that respect, threshold represents the very minimum possible hysteresis when all the magnetic effects have been eliminated. Indeed, it is a property of iron that when a point on the magnetic curve is approached in a cyclic and decreasing manner, the magnetic hysteresis is greatly reduced. Now, when a servo loop is tuned for high gain, the null point can be approached in just that way. Therefore, the ultimate accuracy of the servo loop is better assessed by the threshold, rather than the hysteresis.
In addition, whenever integral control (PID control, for example) is implemented with hysteresis in the loop, the servo loop will exhibit a low-level, steady oscillation that gain adjustment will not eliminate. This condition is called a limit cycle and is one of the many reasons why integral control should not be used in some applications.
The test for valve threshold is difficult to conduct, and it is affected by both operator technique and sensitivity of the instruments used for measurement. Threshold is reported as the ratio of the current change required to affect a reversal in flow increase, divided by the rated current of the valve. For servovalves, a typical value is about 0.5%. It should be apparent that threshold tests are not conducted on overlapped valves.
A Primer on Valve Frequency Response
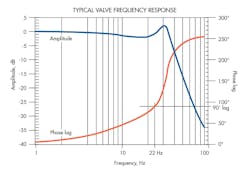
The graph shows typical frequency response curves for a hydraulic proportional valve. The blue trace is the amplitude—a measure of how well the spool travel keeps up with the sinusoidal command signal as the frequency changes. At the low frequency, it is keeping up almost perfectly because the amplitude is 0 dB. Recall that the log of 1.0 is zero, so the spool moves 100% of the distance “asked by” the command signal, the sinusoidal input.
The situation is much different at the highest frequency, about 90 Hz,. The amplitude is down by almost 35 dB. Each 6 dB of reduction represents a halving of the amplitude. That's the nature of using the logarithmic measuring scale, the deciBel. At 35 dB down, the spool travel at 90 Hz is only 1/26th, or about 1/64th of the spool travel at 1 Hz—barely a measurable amount.
The phase lag is also affected by the test frequency, shown as the red curve. At 1 Hz, the lag is only a couple of degrees. At 10 Hz, the lag increases to about 50 deg., and at 22Hz, it reaches 90 deg. It is the 90-deg. phase-lag frequency that defines the frequency response of the valve, sometimes called the bandwidth. This is an important benchmark for a valve because it is the frequency we use in the system design calculation. It is also called (simplistically, if not misleadingly) the valve frequency. When we compare one valve to another, the 90-deg. phase shift frequency serves as the benchmark.
Note that the curve displays a decided increase at about 30 Hz after undergoing a small dip. This rise is called a resonant rise and is caused by some hydromechanical interaction within the valve. The graph is actually formed from a mathematical model of the valve, so we do not know what internal feature specifically causes the resonance. As users of the valve, we don’t really care. We only need to know that this is the way the valve behaves because our test data show that. Such are the advantages of black-box models.
Relating Open-Loop Control to Closed
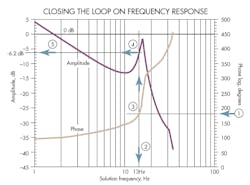
The frequency response curves of a somewhat typical open-loop system are shown in the accompanying graph. The graph was generated with voltage into a proportional amplifier as input and cylinder position as output. A load with a relatively low resonant frequency was applied to the cylinder. That resonance can be seen in the sharp rise in the amplitude curve at about 15 or 16 Hz. We can just barely see the resonant rise in the valve as the small inflection in the amplitude curve at about 30 Hz, which we knew from the valve frequency response. The load resonance has rendered the valve resonance insignificant.
The initial steep slope of the amplitude along with the 90-deg. phase shift is a consequence of the mathematical integration caused by the cylinder converting flow (speed, actually) to position, which always causes 90-deg. of phase lag and a steady drop in amplitude.
To determine whether the closed-loop system will be stable—meaning that it will not break into continuous oscillation—Bode explained than if the amplitude curve is less that 0 dB when the phase lag is 180 deg., the closed-loop system will be stable.
Therefore, once a graph like the one shown on the previous page has been constructed, a five-step procedure can be followed to determine if a system will be stable:
- Find the 180-deg. phase-lag point on the phase axis.
- Project horizontally to intersect the phase-lag curve.
- Project that value down to the frequency axis. In this case, the value is about 13 Hz.
- Project that frequency vertically upward to intersect the amplitude curve.
- Project that point horizontally to the amplitude axis.
We conclude that our system will be stable because the value on the amplitude axis in step 5 is 6.2 dB, which, obviously, is less than zero.
Testing Valves for Frequency Response
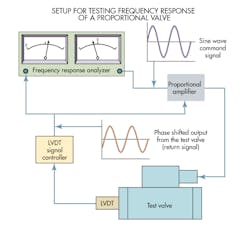
The focal point of the setup for testing a valve’s frequency response is the frequency response analyzer, depicted in the next illustration. This instrument has two basic sections. First, a generator creates the adjustable frequency sine wave. Second, an analyzer section measures the return or feedback signal in both amplitude and the amount of phase lag relative to the sinusoidal input.
The sine-wave output from the generator section serves as the input to the proportional amplifier. It causes the coil current and the coil force to vary in a near-sinusoidal manner. This sinusoidal force causes the spool to cycle back and forth in a near sinusoidal motion.
In the case at hand, the return signal is the output from the valve’s LVDT spool position transducer after it passes through an LVDT signal conditioner. This results in a signal being returned to the analysis section of the frequency response analyzer. The analyzer can then evaluate the amount of phase shift between the command and return signals, and it also measures the amplitude of the return signal. The operator changes the frequency through a suitable range, and the resulting data are a measure of the frequency response of the valve—including the amplifier, the LVDT, and the LVDT’s signal conditioner.
Details on this subject, including formula derivations, are available in the Designer’s Handbook for Electrohydraulic Servo and Proportional Systems. The 786-page Handbook sells for $159 and contains useful information about:
- how to calculate and control pressure losses in hydraulic circuits, subplates, and manifolds,
- how to analyze and control a variety of mechanical loads, including conveyors and belts and triangulated loads,
- dynamic properties of proportional and servovalves and how to incorporate them in your system,
- practical information about electronics, especially transducers and signal conditioning, and
- mobile equipment electrical systems, including batteries and charging systems.
Click here to order a copy. Fill out the PDF order form and mail, fax, or e-mail it to us.
