By Jack L. Johnson, P. E.
To be practical, a hydrostatic transmission requires peripheral equipment, such as a supercharge pump to prevent cavitation, relief valves to prevent excessive pressure, plus a heat exchanger and filter, and a means to account for fluid compressibility.
Describing a model such as this mathematically requires four node equations to accommodate four different nodal pressures. Also required are two torque loop equations — one for the pump shaft circuit and one for the motor shaft circuit.
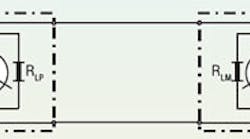
This creates a sixth order system dynamically and six unknowns in steady state. Rather than address all the cumbersome details associated with such a model, we shall instead consider the simple transmission represented in Figure 1 — a Type 1 model with only four loss coefficients in the transmission.
We can justify this simplification by considering the following:
• Performance of the hydrostatic transmission is affected by the transmission differential pressure, not the gauge pressures.
• If the supercharge pressure is relatively low, then the amount of flow through the port-to-case drain leakage path is small and can be ignored. This remaining leakage resistance can be combined in parallel with the port-to-port resistance.
• Because the transmission differential pressure is the dominant operational variable, all gauge pressures can be ignored. Performance, then, can be expressed in terms of differential pressure.
• The equivalent single internal leakage resistance has to be found using the combined parallel effects of the port-to-port resistance and one of the two port-to-case drain resistances. The combined results are called RLP and RLM in Figure 1.
• The study at hand will be limited to one direction of rotation and will not deal with over-running loads, thereby further justifying the above assumptions and approximations. The concepts and conclusions reached here can be extended to bidirectional and over-running operation. However, they are beyond the scope of the present study.
• The study covered in this article will be limited to steady-state performance characteristics only. All the dynamic factors — capacitances and inertias — can be eliminated.
After the simplifications are made, the hydrostatic transmission of Figure 1 can be totally described with three equations — two torque loop equations and one flow node equation.
Choosing a model
No matter which modeling methods may be used, any methodology to properly size a hydrostatic transmission faces the reality that we need to know the loss coefficients before the transmission has been selected! This is why applications engineers resort to using Type 0, ideal models to estimate a priori displacements. Next, they add in a “fudge factor” to account for the losses, then “go shopping” for commercially viable machines. Once the pump and motor are selected, the loss coefficients can be calculated from manufacturers’ performance data. Large OEMs with lab facilities may run tests to acquire the modeling data. At any rate, Type 0 models have their place in the engineer’s repertoire of analytical tools.
Setting up the model
The value of mathematical models is that they can be used to predict the characteristics of circuits and systems before the hardware is built. Indeed, predicting performance is the sum and substance of system design engineering. Engineers have used mathematical models for hundreds of years, but only recently have we called the process math modeling and simulation. The two have become a technology unto itself, appearing under the terms electrohydraulics and mechatronics. For the system at hand, the term hydromechanics will suffice.
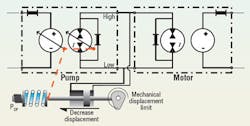
To illustrate the implementation of models, the two torque loop equations and the flow node equation can be used to generate the speed-torque characteristics of the hydrostatic transmission of Figure 1. To make the simulation more realistic, pressure compensation can be added to the pump to limit pressure. That is, after pressure rises to a pre-set level, pump displacement decreases, depicted in Figure 2.
Now, pump displacement depends on the transmission differential pressure. The relationship between pressure and displacement is:
DP = DrP + γP (P–PCP)
where DP is pump displacement, in.3/rev,
DrP is the pump’s rated maximum displacement, in.3/rev,
γP is the pressure compensator gain, in.3/(rev•psi). It is a negative value to cause displacement to decrease with increasing pressure.
P is the transmission’s differential pressure, psid, and
PCP is cracking pressure of the pump compensator, psi.
The equation is valid only under the condition that the P is greater than the PCP. When the pressure is below the cracking point, the pump is at maximum displacement.
Carrying out the simulation
Our simulation will be carried out with pump speed held perfectly constant. This will simulate a laboratory condition where the test operator ensures that the pump is always at the target speed before recording data.
Next, all parameters will be defined for the pump and motor, respectively. These include rated speed (2400 and 3000 rpm), displacement (8 and 4.8 in.3/rev), pressure (3000 for both), mechanical efficiency (93% and 95%), and volumetric efficiency (95% and 93%). The pump’s maximum displacement (8 in.3/rev), cracking pressure (2800 psi), and saturation pressure (3100 psi) is also defined.
The program first takes the pump and motor parameters and calculates the leakage and frictional resistances for both the pump and motor. It outputs those values for reference purposes, and they are displayed as calculated parameters.
The program then uses the four equations previously discussed and the newly calculated parameters to calculate the pressure when no load is on the motor shaft, the no-load pressure. It then calculates the pressure when the load is great enough to stall the motor, referred to as the stall pressure. These two pressure values comprise the pressure limits, from minimum to maximum.
The program then calculates a suitable “step size” and proceeds to solve the transmission equations for each pressure from minimum to maximum, and, of course, taking into account the variable displacement brought about by both the compensator mechanism and the mechanically limited maximum displacement. The result is a set of steady-state performance characteristics consisting of output shaft speed, output torque, input power, output power, transmission differential pressure and lost power.
Not all of the performance data can be included in this brief explanation, however, two sets of performance graphs are. They consist of the speed- torque characteristics, the overall efficiency of the transmission, and a graph of lost power.
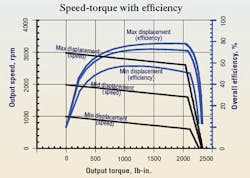
The performance shown in Figure 3 reveals that the overall efficiency maximizes with maximum pump displacement (not surprising) and reaches a value of about 78% at about 1800 lb-in. of torque. In contrast, when the displacement is set to 13 of the rated displacement, efficiency peaks at 1090 lb-in. and 790 rpm and has a value of only 57%.
Notice also in Figure 3 that the no-load speed is approximately 3000 rpm, but it drops off to just over 2600 rpm when the load torque on the motor shaft reaches just over 2000 lb-in. This is caused by the internal leakage resistances, RLP and RLM, causing some of the flow from the pump to bypass the motor as the pressure rises.
The cracking pressure of the pump compensator was set to 2800 psi with the zero-displacement pressure set to 3100 psi to prevent over-pressurizing the transmission. The pressure at motor stall is about 3050 psi, and the pump displacement required to sustain that pressure while supplying the attendant internal leakage is 1.21 in.3/rev.
Power loss and efficiency
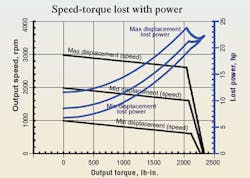
Figure 4 superimposes the lost power onto the speed-torque curves. I prefer to look at power loss rather than overall efficiency. For example, the lost power maximizes at 2040 lb-in. — very near the conditions where the overall efficiency maximizes, 78% at 1800 lb-in. Viewing overall efficiency implies that money is being saved. In fact, this transmission wastes more money on energy at the point of maximum efficiency than it does at a lower load torque. For this reason, a lower torque may be a more economical operating point for certain applications.
Most applications undergo cyclic loading, such as in a transmission used for vehicle propulsion. Random variation always occurs in loading from cycle to cycle. Differing loads exist during acceleration as compared to steady speed, when going uphill versus downhill, or when running with zero payload compared to full payload.
Applying statistical processes to the loading cycle of a machine can be quite revealing regarding energy losses. That is, take a hydrostatic transmission and sample the load torque or transmission pressure at regular time intervals — say every 10 or 20 msec — over a typical daily cycle of the vehicle. The sampled data can be used to construct a histogram of the transmission load that shows the probability that the load will be at certain levels.
That histogram, based on real operational conditions, can be used in conjunction with the power loss diagram to predict how much energy will be lost in the machine when it behaves in a statistically similar fashion in its future. Such histograms can be used with power lost data using math models to explore myriad “what ifs” before ever committing to hardware.
To pursue this idea a bit further, consider that a histogram of transmission loading was skewed to the high end — say, around 2000 lb-in. — meaning that the vehicle spends the lion’s share of its time burning up the maximum amount of power and only a short amount of time in the low lost power regions. It may be advantageous to manipulate the power lost characteristics so as to reduce application losses. It may also be possible to change the application. That is, if the power lost graph prevails in the real hardware, then it may be possible to use it in those applications where the bulk of the time is spent in the lower loss portions of the curves.
The values of the individual volumetric and mechanical efficiencies and the lost power diagram will maximize at points different from that of Figure 4. This fact can be used to tune, or match, a given transmission to a given loading probability diagram. Also, the above graphs were generated using a specific mathematical model for the pump and motor. A different model, ostensibly more complex, can alter the conclusions to the extent that losses may maximize under different conditions. However, these realities do not alter the potential value of power loss diagrams and functional histograms to get a handle on energy, fuel, and money losses.
Handbook serves electrohydraulic system designers
The newly published fourth edition of the Designers’ Handbook for Electrohydraulic Servo and Proportional Systems contains even more useful information than its predecessor, the highly successful third edition, which has become the defacto Bible for electrohydraulics technology.
Now you can learn even more about electrohydraulic systems and their design, including:
• how to calculate and control pressure losses in plumbing, subplates, and manifolds,
• how to analyze and control a variety of mechanical loads, including conveyors and belts and triangulated loads,
• valve dynamic properties and how to include them in your system,
• electronics, especially transducers and signal conditioning, and
• mobile equipment electrical systems, including batteries and charging systems.
There is no limit as to how electrohydraulics is going to revolutionize our industry, so order your copy to secure your career in this dynamic technology. And if certification in electrohydraulics is your goal, the fourth edition of the Designers’ Handbook is essential to your preparation. Don’t risk being left behind in a world where the only constant is rapid change.
To order, visit our Bookstore. Print the PDF order form, fill it out, and mail, fax, or e-mail it to us.
