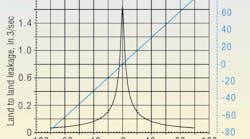
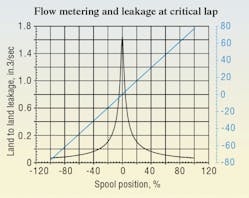
When modeling a proportional or servovalve for subsequent simulation, output data for flow metering and leakage are steady state. As such, they are arranged similar to those that would be collected during testing a real valve, such as an automated data acquisition system. Figure 1 contains the flow metering and land-to-land leakage data over the spool position range of ±100% for the valve model from previous discussions.
The first thing to note in Figure 1 is that the valve is critically lapped. Looking at the flow metering curve, the slope of the flow metering curve does not increase or decrease as it goes through zero. This is an example of a sort of “perfect” flow grinding result. This is, more or less, the aim of the flow grinding technician in a real valve. Such near-perfect performance is not always achievable in a real valve because of the need for practical tolerances and cost constraints. However, it is simple to achieve in simulation, even though finding critical lap is a trial-and-error process.
The second thing to note is that the peak value of the flow is about 1.84 in.³/sec, whereas the specified input is 2.75 in.³/sec. This discrepancy is caused by unknowns existing at the outset of the simulation. We do not know where the spool will be when the leakage maximizes, so we can only guess at what that might be.
The value of the peak leakage in the input data was set to the value of the two flow functions (hyperbola and straight line) at their point of transition. However, the point of transition is not necessarily the point where the leakage peaks.
The results in Figure 1 depict a critically lapped spool. We do not always know from the actual test data if the valve is critically lapped. Therefore, a trial-and-error process is applied (multiple successive program executions with different values of overlap) until critical lap is achieved in the output. The peak leakage then becomes whatever that degree of overlap delivers.
Pressure metering
Pressure metering, as explained in a previous edition, gives the information needed to understand how the valve brings the actuator to a stop. Figure 2 shows the pressure metering characteristics per port. The data were all generated from the math model of the valve. It clearly shows how the metering is confined to the center region of spool travel. In fact, as shown, the graph is of little value because the metering is so compressed.
Nonetheless, the redeeming value is that a pressure metering rule-of-thumb is valid: Pressure metering is confined to a valve’s overlap plus about 5% of spool travel. This is certainly supported by the graph in Figure 2. But the figure also points out the need to expand the null zone so that the metering is more fully displayed and with greater resolution. This is done by running the simulation program again, but with the spool travel range substantially shortened, which will be done shortly.
Valve coefficient metering
The entire model development has been directed at synthesizing mathematical functions whose evaluations produce data that mimic the actual performance of the valve — more particularly, development of mathematical functions that describe the variations in the flow coefficients in going from overlapped to underlapped and vice versa. It seems fitting, then, that the flow coefficient data be displayed as well.
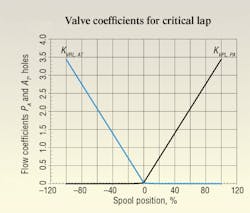
ISO 10770-1 mandates that the per land flow metering be presented for all four lands in a display similar to that of Figure 3, which shows the flow coefficient, not the flow. However, the coefficients and the flows differ only by the square root of the constant pressure that was used in testing. Therefore, no difference exists in the shape nor the conclusions to be drawn therefrom.
Figure 3 shows only two of the lands, not all four. The rationale for using only two is that for the input data, the other two lands are identical to the ones shown here. Therefore, the curves would perfectly overlay those shown unless one uses the suggested ISO 10770-1 graphing format. There, cartesian quadrants III and IV are shown, the other two lands are “flipped” vertically and are, thus, separated and displayed in the lower half of the graph.
ISO 10770-1 graphing format is important when there are significant amounts of asymmetry among the four lands. For our mathematically pure and totally symmetrical model, there is no new information to be added, thus Figure 3 suffices.
Recall in the model development that two representative regions consist of the overlap (closed) and the underlap (open). Figure 3 shows the two regions and also that the transition from one function to the next takes place right at the origin. The transition takes place sharply and over a very narrow range of spool travel — again, a desired result for a nominally “zero-lapped” valve.
This further supports the conclusion that the valve is critically lapped and represents the best in flow grinding that can be accomplished. In the context of simulation, the flow grinding is actually analogous to the trial-and-error process of tweaking the input value of the overlap to get the best possible flow metering. In actual flow grinding — also a trial and error process — the overlap is literally ground off the overlapped spool.
Handbook serves electrohydraulic system designers
The newly published fourth edition of the Designers’ Handbook for Electrohydraulic Servo and Proportional Systems contains even more useful information than its predecessor, the highly successful third edition, which has become the defacto Bible for electrohydraulics technology.
Now you can learn even more about electrohydraulic systems and their design, including:
• how to calculate and control pressure losses in plumbing, subplates, and manifolds,
• how to analyze and control a variety of mechanical loads, including conveyors and belts and triangulated loads,
• valve dynamic properties and how to include them in your system,
• electronics, especially transducers and signal conditioning, and
• mobile equipment electrical systems, including batteries and charging systems.
There is no limit as to how electrohydraulics is going to revolutionize our industry, so order your copy to secure your career in this dynamic technology. And if certification in electrohydraulics is your goal, the fourth edition of the Designers’ Handbook is essential to your preparation. Don’t risk being left behind in a world where the only constant is rapid change.
To order, visit our Bookstore. Print the PDF order form, fill it out, and mail, fax, or e-mail it to us.
