This file type includes high resolution graphics and schematics when applicable.
Electric and pneumatic drives are widely used to perform a variety of handling tasks. While electric drives are highly dynamic, very precise, and demonstrate tailored control concepts for position, velocity, and force, pneumatic drives are low in installation and maintenance costs, and offer both a flexible and robust design. The bottom line is that compressed air is an expensive source of energy, whereas electric drives present high investment costs. To find the balance between cost, efficiency, and functionality, various factors have to be considered, including fulfillment of the task regarding velocity and forces, expected energy consumption, life cycle costs, and the payback period over the lifetime of the system.
The major challenge with the high-energy consumption of pneumatic drives is the absence of a defined sizing approach. To solve this problem, a new approach has been developed that can help designers choose the most cost-effective drive solution between different technologies and over the lifetime of the drive—Exonomy analysis.
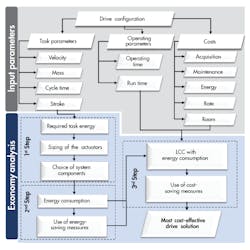
The starting point for Exonomy analysis is to consider input parameters—drive configuration, task and operating parameters, and costs. The Exonomy method is comprised of three main steps: exergy (maximum available energy)-based sizing of the actuators; expected energy consumption and definition of possible energy-saving measures; and LCC analysis over the lifetime of the drive (Fig. 1).
Task Energy Calculations for Actuator Sizing
Pneumatic and electric drives exhibit different principles of energy transmission, which makes their energetic analysis more complicated. In many cases, a standard pneumatic drive shows a lower energy efficiency in comparison to an equivalent electric drive. When electric actuators are chosen according to required power they take into account the dynamic parameters of the task, while pneumatic drives are chosen by considering only load-based parameters. To overcome this difference in approach, most designers choose oversized pneumatic drives for their applications.
The key to this approach is in adjusting the energy transmitted by the system to the required energy of the task at hand. To calculate generated energy transmitted by the cylinder, the energy balance includes calculating the exergy and the losses due to friction and damping. The relationship between these values is presented by the sizing factor, SF.
The analysis of the exergy, sizing factor, and the task energy required is expressed in an equation to determine the diameter (bore) of the cylinder. Overall, the equation must include the dynamic and static load characteristics of the task—including damping and friction forces—to provide the precise calculation of the geometry. Typically, the task of a pneumatic drive is to move a stated mass for a particular distance within a specific time period. Dynamic parameters, such as velocity and force, can be described as task energy, Etask. Task energy consists of potential and kinetic energy of the moving mass.
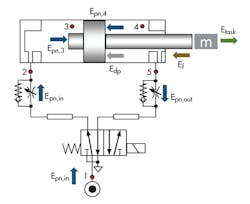
Using Fig. 2, we’ll analyze the maximum available energy provided by the cylinder drive. Incoming pneumatic energy is transformed into energy of motion mass. The work done by the drive within the motion time is represented by the pneumatic energy of the compressed air Epn. The cylinder moves from the meter-in pressure, and the compressibility of the air causes pressure changes in the meter-out chamber. Therefore, the available pneumatic energy is derived by the difference between energies at the meter-in and meter-out chambers.
This maximum available energy is described by thermodynamic value exergy Eex. However, not all pneumatic energy can be transformed into mechanical energy. The two factors that prevent this transformation are friction, Ef, and damping energy, Ed. Both act in the opposite direction of the piston motion, so energy balance can be described as:
Energy balance, then, shows that the well-dimensioned actuator must account for the losses when calculating the exact amount of energy to fulfill the motion task. The degree of over- or undersizing of the actuator is distinguished as a relation between right and left parts of Equation 3 and represented by the sizing factor. Therefore, the sizing factor of the well-dimensioned actuator is calculated as a relation between loss and exergy:
Analyze the chamber volume and use the first and second laws of thermodynamics to calculate the exergy provided by the cylinder. During machine concept, choose the geometric parameters of the system to determine the working pressure needed. Once this has been done, calculate the cylinder bore for horizontal and vertical motion using energy-exergy balancing and equations 4 and 5.
Calculating cylinder bore for horizontal and vertical motions differs due to the potential energy present in the system. The formulas take into account all forms of energy, so they apply to various motion types. The formula for vertical motion is based on the relationship between piston and rod diameters with the coefficient, n (usually assumed as 1/3).
Dynamic parameters, such as pressure, stroke, and motion. must be assumed as static at the end of the motion. Based on Equation 3, bore calculations also include sizing factor assumptions on losses due to mechanical friction and pneumatic damping. The sizing factor is determined for the horizontal and vertical drives for typical parameter ranges.
Sizing Factor Calculations
The sizing factor takes into account exergy losses that occur during motion, such as mechanical friction and end-of-stroke damping energy. Damping energy consists of kinetic impact and compaction .
Impact energy depends on impact velocity and can be considered negligible in relation to compaction energy. Compaction energy is the combination of the kinetic energy of the load as it is applied to the compression energy in the cushioning chamber. The purpose is to bring the piston and load to a smooth and gentle stop against the endcap. Compaction energy is calculated as an exergy produced in the cushioning chamber under the isothermal system behavior:
Friction losses also have to be considered in the overall energy balance. Friction losses can be calculated using the friction force, velocity, and motion time as follows:
Although friction losses occur at the sealing end of the drive’s components and depend on such factors as Coulomb friction, velocity dependent friction, and Stribeck’s effect, they can be calculated by force balancing:
Friction and damping losses depend on the geometric parameters of the cylinder and pressure levels. To reach that goal, the sizing factor has been predicted using the first and second laws of thermodynamics and Equations 11 and and 13, with prescribed cylinder geometries for different dynamic parameters.
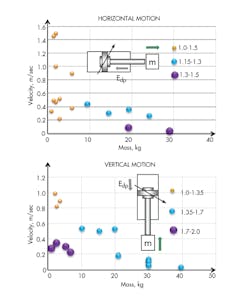
The next step calculates the sizing factor for damping and friction for both motion types. The cylinder parameters for different loads and velocities are presented in the previous study. The limit of the sizing factor was distinguished using the strategy of pressure lowering. The studied task parameters varied from 0.2 kg to 40 kg and 0.05 m/sec to 1.5 m/sec presenting the most typical applications for handling tasks.
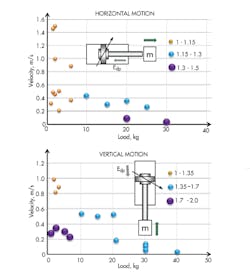
Damping sizing factor for horizontal motion is represented by values from 1 to 1.15 for the mass value under 10 kg and velocity up to 1.6 m/sec and rising with an increase of mass and decrease of velocity. It mostly depends on motion mass and, therefore, on the cylinder geometry. The damping sizing factor of vertical drives shows the same tendency as the horizontally mounted cylinder. In this case, the maximum sizing factor is required for the lower mass and lower velocity. The slower compression of air in the damping chamber requires more compaction energy.
Next is friction sizing factor. Friction energy can easily be several times larger than the task energy sizing factor for horizontal motion. Figure 4 shows the growth of sizing factor within particular velocities. It can be explained by how the friction force affects the velocity of the stroke. The same tendency shows the friction sizing factor of the vertical drive, but with lower values. The task energy, in this case, is higher than the friction due to the action of the potential energy. All this leads to the importance of the damping and friction losses. Moreover, it outlines the difference between vertical and horizontal motion, which has to be considered to arrive at the proper sizing.
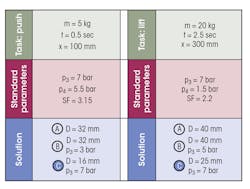
Using the presented sizing factor, the cylinder diameters have been calculated using Equations 9 and 10 (option C) and compared with other approaches for the current cases for the specific task (Fig. 5).
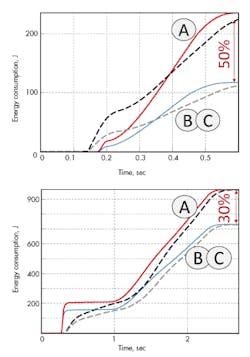
Note that option A presents the most common choice of design parameters based on the load sizing approach under the working pressure level of 7 bar. Option B offers the reduced pressure based on exergy balancing with the same cylinder diameter as in the first case. Finally, option C provides information for the optimum cylinder sizing under the standard working pressure using exergy balancing in analog to option B. The measurement and simulation results for the horizontal and vertical drives for the options A, B, and C are presented in Fig. 6.
Economic Analysis of Studied Drives
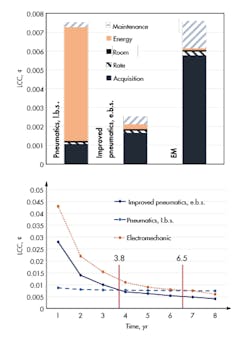
The calculation of LCC for each drive was done under the following working conditions: 3.2 million cycles per year and 5,000 km lifetime of the actuator. Lifetime for other components is neglected.
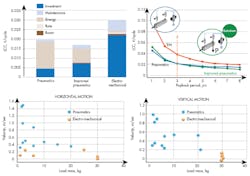
The results on the left side of Fig. 7 show the LCC for the drive used in our example. In this case, the LCC of standard pneumatic drives and EM drives are the same, whereas the improved system shows a significant cost reduction. However, the acquisition costs of the improved system are higher due to the use of a pressure regulator. The graph on the right shows the amortization time for the systems due to their lifetimes. These results show a payback period of 3.8 years for the improved system and 6.5 years for the electromechanical drive.
Finally, on the basis of the calculations presented here, all costs and time parameters are observed and guidelines for selecting pneumatic or EM drives can be formulated.
Figure 8 shows the most cost-effective drive solution. All in all, the preferred application fields of both technologies are characterized by the actual mean velocity of the motion task and additionally by stroke and load masses. This proves the importance of considering the motion time for drive system selection.
Elvira Rakova, M.Sc., is a research assistant with the Institute of Fluid Power at the Technical University of Dresden, Germany. Contact her for an unedited version of this paper or to answer questions.
This file type includes high resolution graphics and schematics when applicable.
